What is a Data Frame in R
I use data frames nearly every time I write a script in R. I’m usually reading and storing the contents of several CSV files to process its contents. The more you work in R, the more you are likely to use data frames.
The base R definition of a data frame that comes from the documentation is a really dry way of defining what they really are.
Data frames are “tightly coupled collections of variables which share many of the properties of matrices and of lists, used as the fundamental data structure by most of R’s modeling software.”
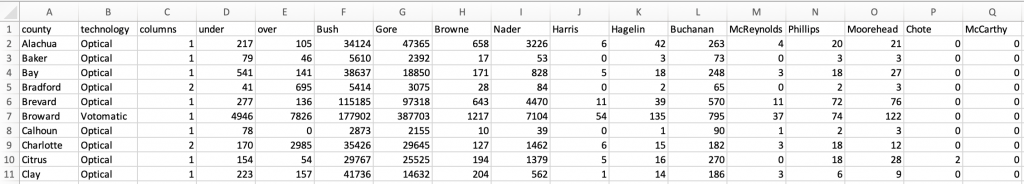
I like to think of data frames in R as if they are read-only spreadsheets. They have rows and columns just like a spreadsheet, and have a header row that allows you to access the information in the “cells”. Data scientists who use R call rows “observations” and columns “variables”, so don’t be confused if you hear those terms thrown around.
CSV of Florida 2000 Ballot Data opened in Excel
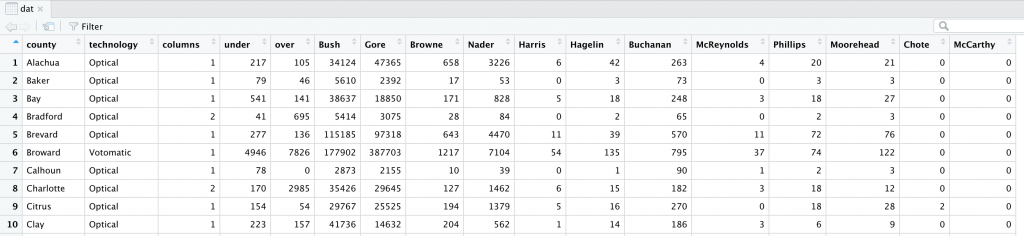
Data frame in R using the Florida 2000 Ballot data dataset
The data in the spreadsheet representation of the CSV file can be modified by clicking into a cell and entering a new value. The data in the data frame can be viewed but can only be modified using code.
Creating a Data Frame
Create a Data Frame Using a Function
A data frame can be created in many ways. A lot of functions in R that read data from spreadsheets or CSV files will automatically use a data frame. Other times, functions will store the data in lists that you can then force into a data frame.
Let’s look at the read.csv() function. This function does just what you think it will do. You feed it a file path to a CSV file, and it will open the file, read in the data and then guess the type of data being read in for each column.
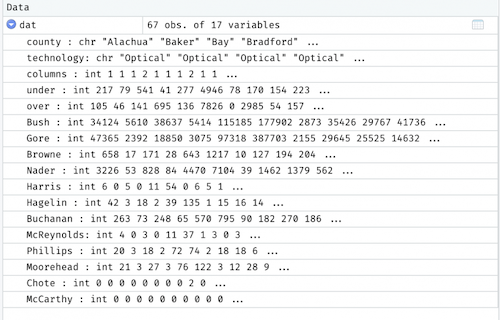
dat = read.csv("~/Downloads/fl2000.csv")
Clicking on the dropdown arrow in the environment area will allow you to see a preview of the data.
Clicking on the name of the data frame (dat) will show you the full view.

Manually Creating a Data Frame
In order to manually create a data frame in R, you’ll need to make sure your data has the same number of rows (observations). If one of your lists of data has 3 rows, but your other set has 2 rows, R is going to throw a fit when it tries to create the data frame.
Let’s say we have three separate character vectors containing information on the makes models and battery ranges for three cars. Instead of having the data separated in three different lists, we’ll combine them into a data frame:
1
2
3
4
make = c('Chevy','Ford','Chevy')
model = c("Volt", "C-MAX Energi", "Bolt")
bat_range = c(53, 20, 259)
car_data = data.frame(make, model, bat_range)
This code will result in the following data frame:
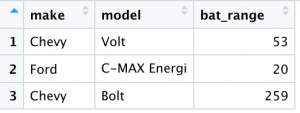
If we were to have two of the three bat_range data points, and we tried to create a data frame, we would receive the following error message:
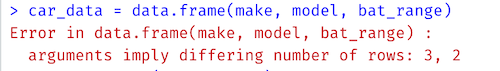
If you see this error message (…arguments imply differing number of rows: 3, 2) when creating a data frame, it just means that it was expecting three values, but only received two for the input.
Conclusion
Data frames are an integral part of R programming language. I think it’s easiest if you think of data frames like read-only spreadsheets that contain sets of data. Data frames are created for you automatically when you use functions such as the read.csv() function to import data from CSV files. Data frames can also be created manually using vectors of the same lengths.
You can read more about data frames in the R documentation or by typing ?data.frame into the R Console.